Translating Drinking Trends into Easy-to-Use Tools for Health Practitioners and Patients
Highlights
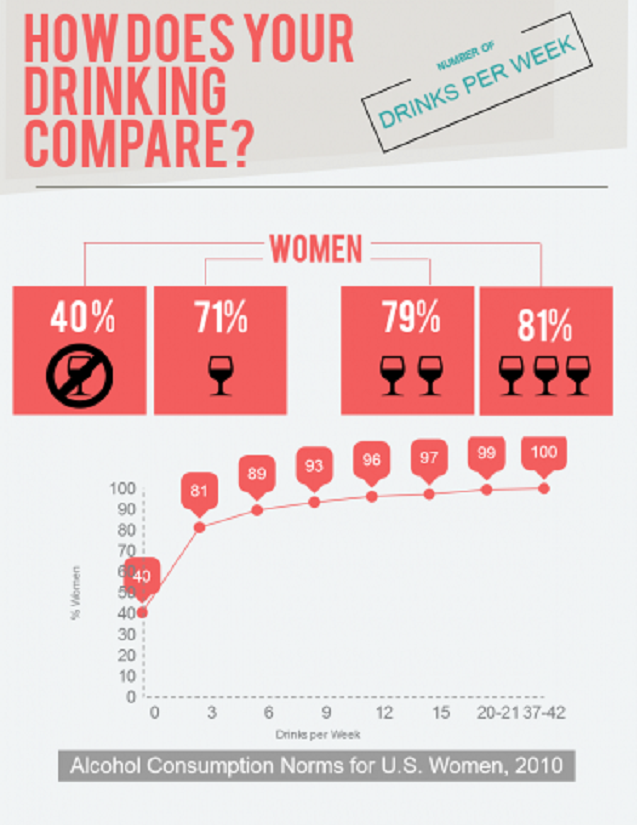
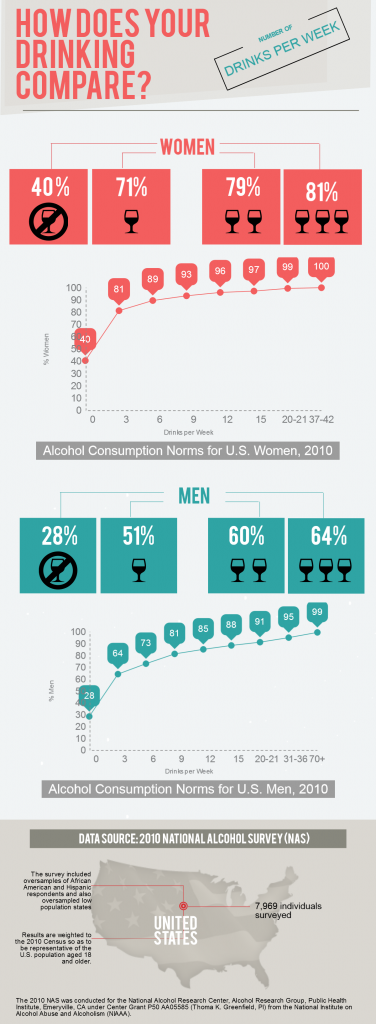
Researchers at PHI's Alcohol Research Group and the National Alcohol Research Center looked at the number of drinks both women and men said they consumed per week on average in the previous 12 months—and then turned that data into a simple, streamlined norms chart for practitioners to use in conversations with clients.
1.5K+ downloads of the U.S. Drinking Norms chart, used by practitioners with patients across the country
-
Focus Areas
Alcohol, Tobacco, Drugs & Mental Health, Health Care & Population Health -
Issues
Alcohol -
Expertise
Health Education & Promotion, Outreach & Dissemination
As a health practitioner, one way to assess a patient’s drinking habits is to have them compare their current consumption level to how much other people across the country are drinking.
Using data from the 2015 National Alcohol Survey, researchers at PHI’s Alcohol Research Group and the National Alcohol Research Center looked at the number of drinks both women and men said they consumed per week on average in the previous 12 months, from individuals residing in all 50 states and Washington DC.
Available as a PDF or infographic, their findings were recreated as an easy-to-understand norms chart which has been downloaded over 1500 times and is now used by practitioners with patients across the United States.
Work With Us
You change the world. We do the rest. Explore fiscal sponsorship at PHI.
Support Us
Together, we can accelerate our response to public health’s most critical issues.
Find Employment
Begin your career at the Public Health Institute.