With the COVID-19 crisis, longstanding gaps and disparities in health have only grown wider. Individuals living with chronic disease, people in under-served areas, and people of color have been hit the hardest during the pandemic. In one recent study, a team from the Commonwealth Fund revealed that COVID-19 is more prevalent and deadly in US counties with higher black populations.
“There has been a fair amount of conversation about COVID-19 being an equal opportunity killer. But frankly, that’s just not true,” said Helen Dowling, MPH, data in action coordinator for the Public Health Alliance of Southern California. “There are communities that are dying at much higher rates than others, and it’s really important that we look at the data, spell it out by race and ethnicity, and focus on how we can improve the communities where these individuals live.”
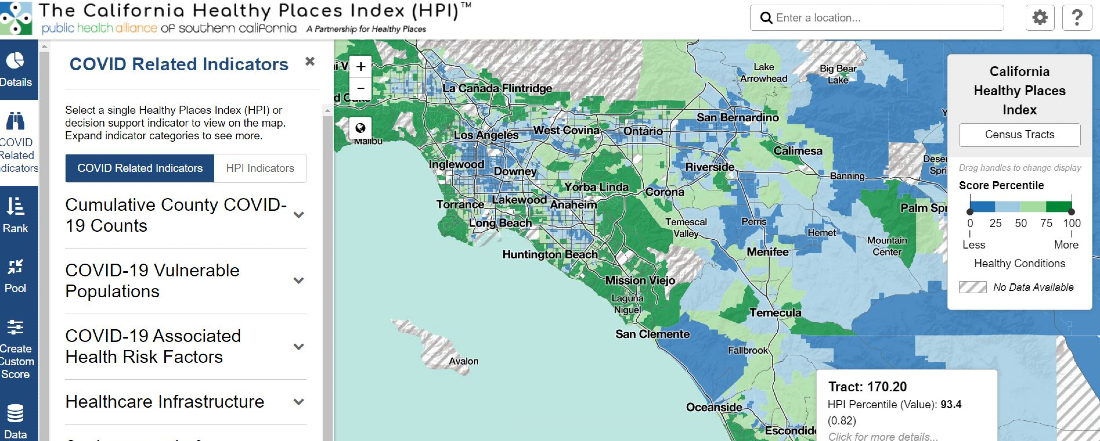
The Public Health Alliance of Southern California developed their Healthy Places Index to help guide the allocation of resources to disadvantaged communities, and has recently released an interactive COVID-19 Healthy Places Index (HPI) Resource Map. The map highlights the increasing inequities and gives policy makers a tool to target resources to those most in need.
“A lot of tools show the distribution of COVID-19 cases and deaths, but there aren’t many that go to the level of detail to provide information about all these community conditions that could exacerbate the virus,” said Dowling. “That’s why our map goes down to the census tract level, because even county-level information can obscure a lot of the variation among communities. In Los Angeles, you can be within a 20-minute walk of some of the richest communities in the state and some of the very poorest, by community conditions. And it’s just a couple of miles. You don’t see that if you’re looking at data at a higher geography.”
Click below to read the full article.
Originally published by Health IT Analytics

You change the world. We do the rest. Explore fiscal sponsorship at PHI.
Together, we can accelerate our response to public health’s most critical issues.
Begin your career at the Public Health Institute.
Communities across the U.S. and around the world are grappling with dangerous wildfires and extreme heat. These threats disrupt and uproot communities and pose serious risks to environmental and community health—from rising temperatures, unhealthy air pollutants, water contamination and more. Find PHI tools, resources and examples to help communities take action and promote climate safety, equity and resiliency.